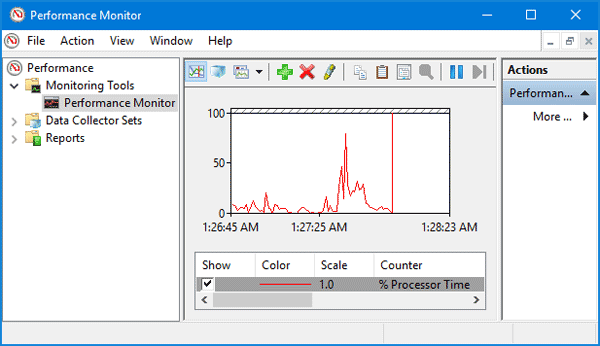
Performance Monitor is Windows’ built-in utility that lets you monitor almost every aspect of performance, including CPU, memory, file system, database, and network usage. This is really useful for IT admins to troubleshoot performance issues or determine where bottlenecks might occur. In this tutorial we’ll show you the quickest ways to open Performance Monitor in Windows 10.
Method 1: Open Performance Monitor from Start Menu
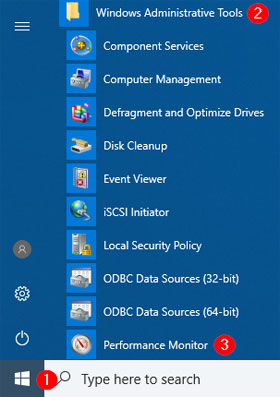
Click the Start button. Scroll through the app list and find the System Administrative Tools section. Expand it and click Performance Monitor.
Method 2: Open Performance Monitor via Run
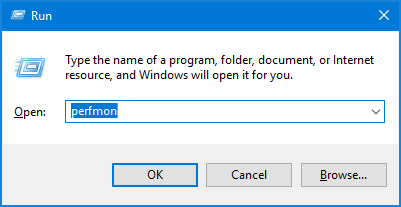
Press the Windows key + R keyboard shortcut to open the Run command, type perfmon and hit Enter.
This will launch Performance Monitor utility quickly.
Method 3: Open Performance Monitor with Cortana Search
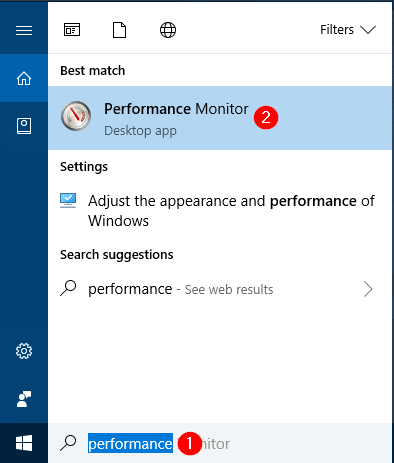
Type “performance” (without double quotes) inside the Cortana Search box on the taskbar, and then click the appropriate result.
Method 4: Open Performance Monitor from Control Panel
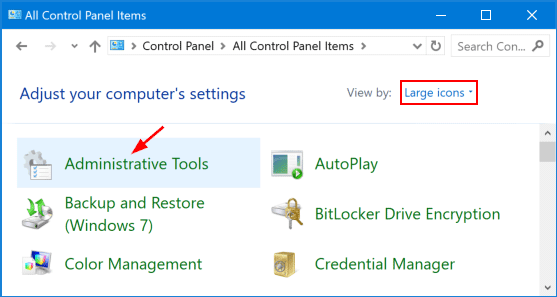
Open the Control Panel in Large icons view, and click Administrative Tools.
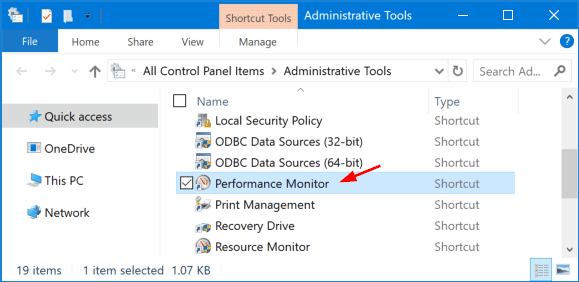
In the next window, you can double-click the Performance Monitor shortcut to open it.
Method 5: Open Performance Monitor from Computer Management
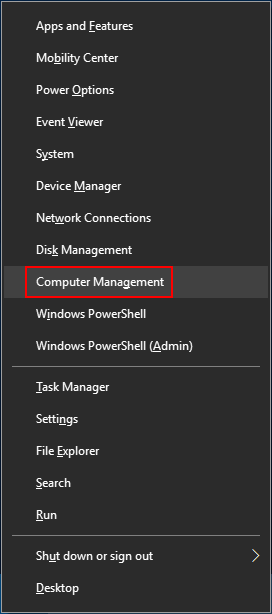
Use the Windows key + X keyboard shortcut to open the Power User menu, and select Computer Management.
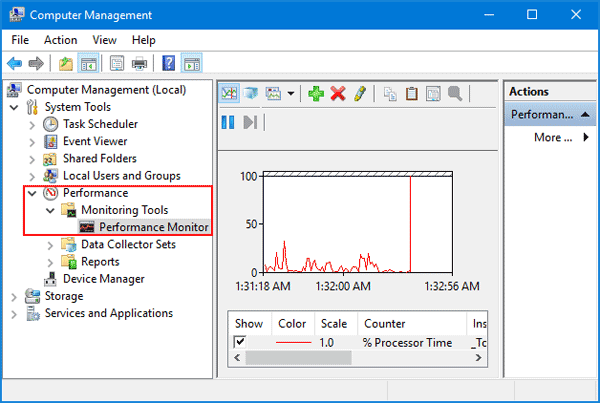
In the left pane of Computer Management, expand to Performance -> Monitoring Tools and you can access Performance Monitor.
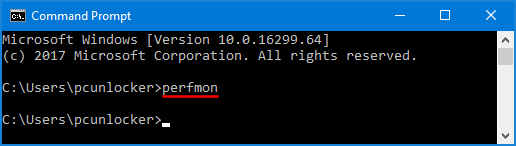
Method 6: Open Performance Monitor from Command Prompt or PowerShell
Open the Command Prompt or PowerShell, then type perfmon and press Enter to open Performance Monitor.
That’s it!